

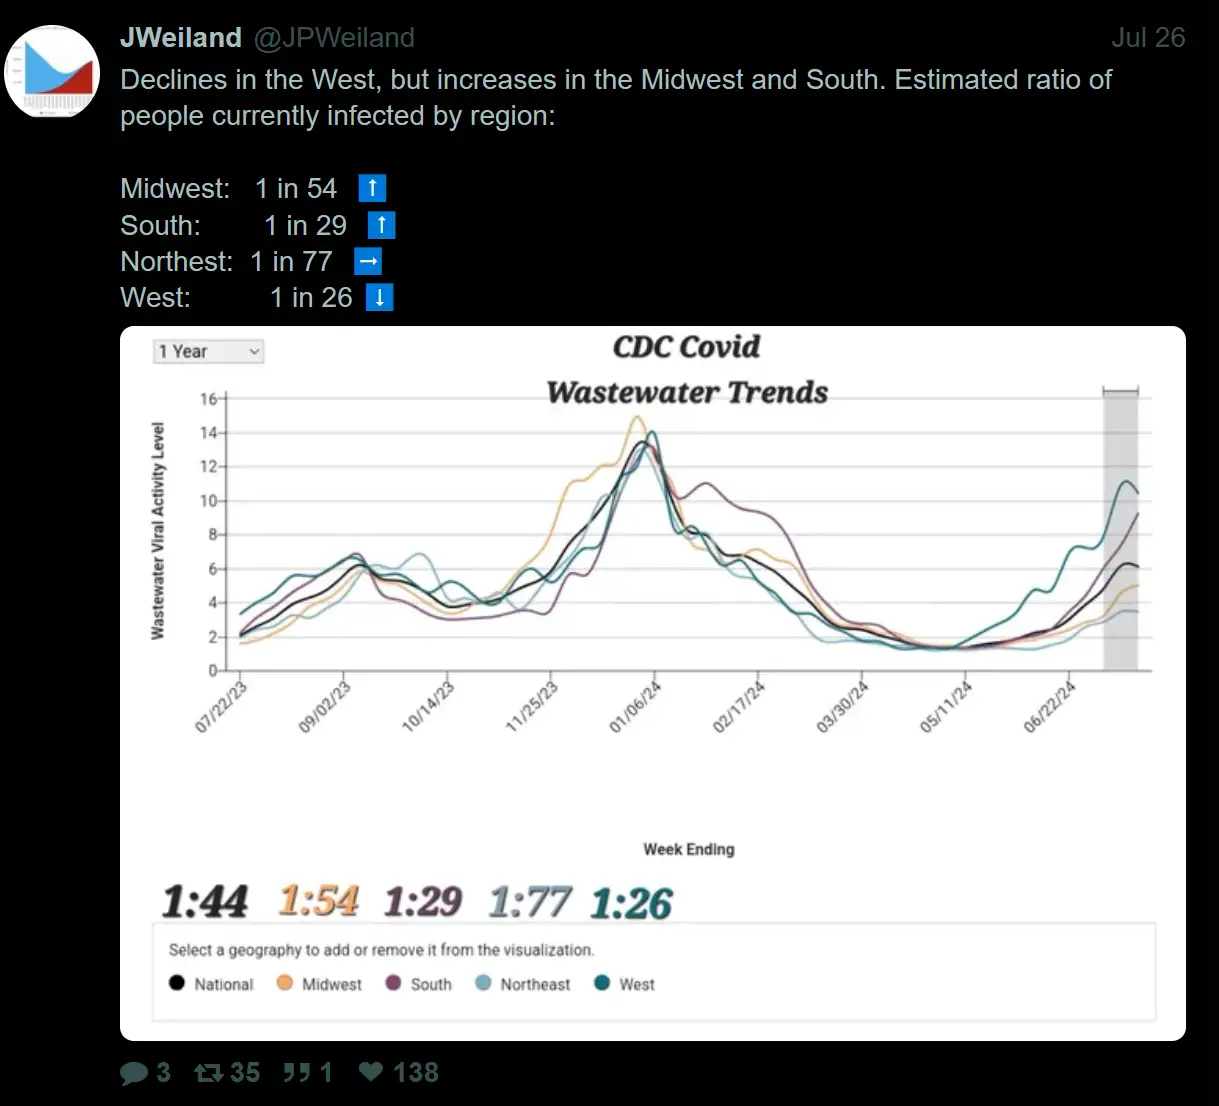
1 in 26 people have covid on the west coast. 1 in 29 in the South. The rest of the country soon to follow.
There is also a new variant appearing (KP.3.1.1), which has a significant mutation which allows it to escape immunity gained from previous variants. It’s expected to add to and extend the current waves.
It’s less deadly than before, thankfully, and new variants haven’t seemed to cause as much of a problem as the first few waves, but the new normal is still several times worse than the worst flu season, if only because it’s around and spreading significantly most of the year. It’s pretty neat how we are living in a time where we can watch society get significantly worse in real time on multiple fronts, including the spread of disease! And by “pretty neat” I mean: 
Good thing brandon ended the pandemic by getting rid of testing, otherwise it might look bad right now!
The point of the graph is showing we’re in the midst of a surge. But, it’s a high level average and is not at all a good indicator of local Wastewater levels. Covid is way beyond seasonal, surging multiple times during the year. The ratio estimate is probably tracked to testing positivity rates, so it’s probably worse. But, this current variant is showing a lot of gi issues so it’s possible that what little Wastewater numbers we have are even more unreliable, always a possibility and a consequence of suppressing all the other resources that we could be using to track this literal shit storm.