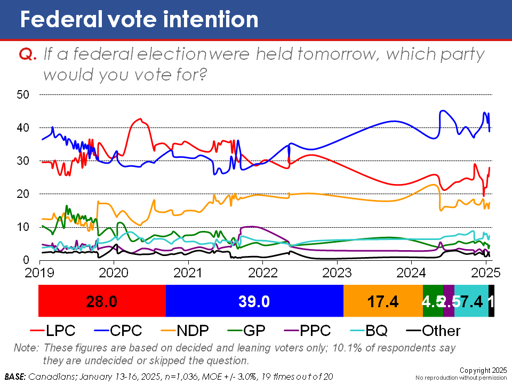
The Liberal Party has seen a remarkable turnaround in its fortunes in recent weeks. Following Chrystia Freeland’s resignation a month ago, the Conservative lead had reached an all-time high of 25 points. In our latest polling, however, that advantage has narrowed to just 11 points, with the Conservatives leading 39 points to 28. At 17 points, the NDP is in third place, and their declared intention to bring down the government does not appear to have produced any benefits.


Can I just take a minute to vent about this data viz
They have used a spline like a hobby spline and not a smoothing spline on that chart. It is a major pet peeve of mine when people use these curves to “interpolate” and make data look prettier. If you are interpolating points on a chart you need to choose a curve that actually fits through all the points, and is smooth.
There are points on this chart where the data inverts by over 90° and goes backwards, so you have more than one y point on the same x axis. You can’t tell where the data points are and these curves absolutely cannot represent voting sentiment. A scatter plot, or regular line plot would have worked perfectly fine, but instead EKOS who should be good with data has created these mangled to fuck charts…
Another downfall of these types of curves is they can create bends where no data is, which means they tell a story that has zero basis in reality, but it makes the first derivative smooth. That same effect can create curves which extend outside of the data range, but that’s not an issue on this particular chart.